How to make sense out of the recent market behavior? We all experienced a painful decline in December 2018 before the markets took a sharp (and unexpected) about-face and delivered the biggest first-half-of-the-year in 20 years and the best quarter since 2009.
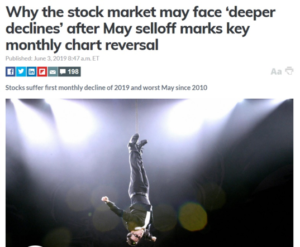
 The volatility continued in the second quarter with April up 3.5%, then May dropped -6.8% and the news media began pushing stories like the headline and graphic seen below. The article had all sorts of data and charts about impending market trouble. Then June happened, and the Dow shot up 7.8% delivering its best June since 1938!
Thus, the surprise upward trend of 2019 has continued through the second quarter despite what would normally be considered warning signs in the economy, the global trade markets and corporate earnings.
If we could simply stop the year at this point, the gains would be unusually high for a typical 12-month period; for six months, they are extraordinary. Perhaps we should celebrate cautiously.
Just about every investment asset produced gains in 2019’s second quarter. The Wilshire 5000 Total Market Index—the broadest measure of U.S. stocks—rose 3.99% in the most recent three months, and now stands at an 18.66% gain for the year. Looking at large cap stocks, the widely-quoted S&P 500 index was up 3.79% in the second three months of the year and is up 17.35% in the first half of 2019.
Meanwhile, the Russell Midcap Index has delivered a 21.35% return in the first six months of 2019. As measured by the Wilshire U.S. Small-Cap index, investors in smaller companies gained 2.03% in the second quarter and are up 17.85% so far this year. The technology-heavy Nasdaq Composite Index gained 4.40% in the second three months of the year and is up 20.66% at the year’s half-way point.
International investors are also sitting on gains. The broad-based EAFE index of companies in developed foreign economies gained 2.50% in the second quarter and is up 11.77% so far this year. In aggregate, European stocks are up 13.20% in 2019, while EAFE’s Far East Index has gained 7.80%. Emerging market stocks of less developed countries, as represented by the EAFE EM index, lost 0.31% in dollar terms in the second quarter, but the index still up 9.22% for the year.
Looking over the diversifying investment categories, real estate, as measured by the Wilshire U.S. REIT index, posted a 1.63% gain during the year’s second quarter, for a 17.92% gain for the first six months of the year. The S&P GSCI index, which measures commodities returns, lost 1.42% in the second quarter, but is still up 13.34% for the year. Energy prices are up 22.80% in 2019, while precious metals have gained 8.86% so far this year.
The bond markets continue the long stretch of low-yield environment, coupled with either a flat or inverted yield curve, depending on where you look. Coupon rates on 10-year Treasury bonds have dropped to 2.01%, while 6-month bonds are now yielding a higher 2.09%. Five-year municipal bonds are yielding, on average, 1.34%, down from 1.89% last quarter, while 30-year muni yields have fallen to 2.40% on average.
What’s going on? It’s tempting to think that the bull market is running out of steam, in part due to the fact that it’s not easy to see how valuations can go much higher. The price-to-earnings ratio of the S&P 500 index–a popular way of valuing stocks–is 21.83 on a trailing basis, compared with a 10-year average of 17.87, and a long-term historical mean of 15.75. At the same time, a popular haven for retreat from the markets–gold–is also above its historical value; the precious metal is not far from its highest level in six years, at $1,413 an ounce.
Bonds are not attractive investments at the 2% range for Treasuries, especially when your yield on six-month bonds is higher than if you take the risk of investing over ten years.
Moreover, there is growing uneasiness about a global slowdown in economic activity, and trade wars and the threat of trade wars are not likely to boost the global economy, even if the recently-announced detente between the U.S. and China holds. Sluggish profit and economic growth are not normally a recipe for higher stock prices.
You might imagine that a strong first half of the year would normally be followed by a drop in value over the second half, but that hasn’t necessarily been the case historically. In years in which the U.S. market rose in the first half of the year, the odds of a positive second half are 72%. That certainly doesn’t guarantee anything, but it does suggest that market movements tend to be much harder to predict than one might imagine.
The roaring start to 2019 was a nice surprise considering the 20% downturn at the end of 2018. We can expect to be surprised again, either on the downside or the upside, in the second half of this year. Either way, we will continue to look for new opportunities and investable trends to add additional value to portfolio returns.


